- Products
- SCALE.sdm
- Collaboration
- Analysis and Reporting
- AI and ML Integration
- Systems Engineering
- Open Platform
- Modular Platform Design
- Add-ons and Tools
- Sales Partners
- Simulation Data Management
- Products
- SCALE.sdm
- Collaboration
- Analysis and Reporting
- AI and ML Integration
- Systems Engineering
- Open Platform
- Modular Platform Design
- Add-ons and Tools
- Sales Partners
- Simulation Data Management
- Career
Back
- Products
- SCALE.sdm
- Collaboration
- Analysis and Reporting
- AI and ML Integration
- Systems Engineering
- Open Platform
- Modular Platform Design
- Add-ons and Tools
- Sales Partners
- Simulation Data Management
- Career
Back
Suchergebnisse
New Add-on: Report Designer – Create Reports Easily and Interactively
Presenting complex results from simulations and tests clearly and understandably is often a challenge. This is where the Report Designer in SCALE.sdm comes into play – an add-on that allows you to visualize your result data directly within the platform in fully customizable, interactive reports.
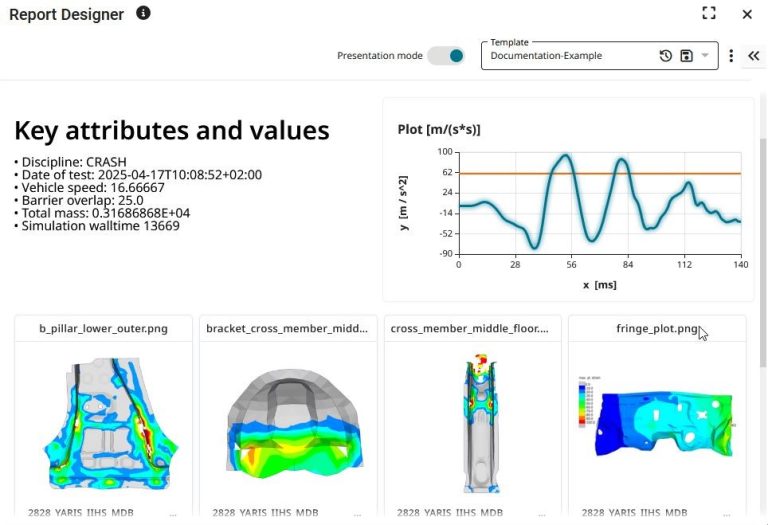
By combining charts, tables, images, videos, and text into dynamic layouts, the Report Designer makes it possible to turn raw data into meaningful insights – tailored precisely to your project’s requirements.
Dynamic Reporting – Directly Connected to Your Data
In many development environments, simulation and test results are still evaluated in isolated tools, often requiring manual exports or disconnected spreadsheets.
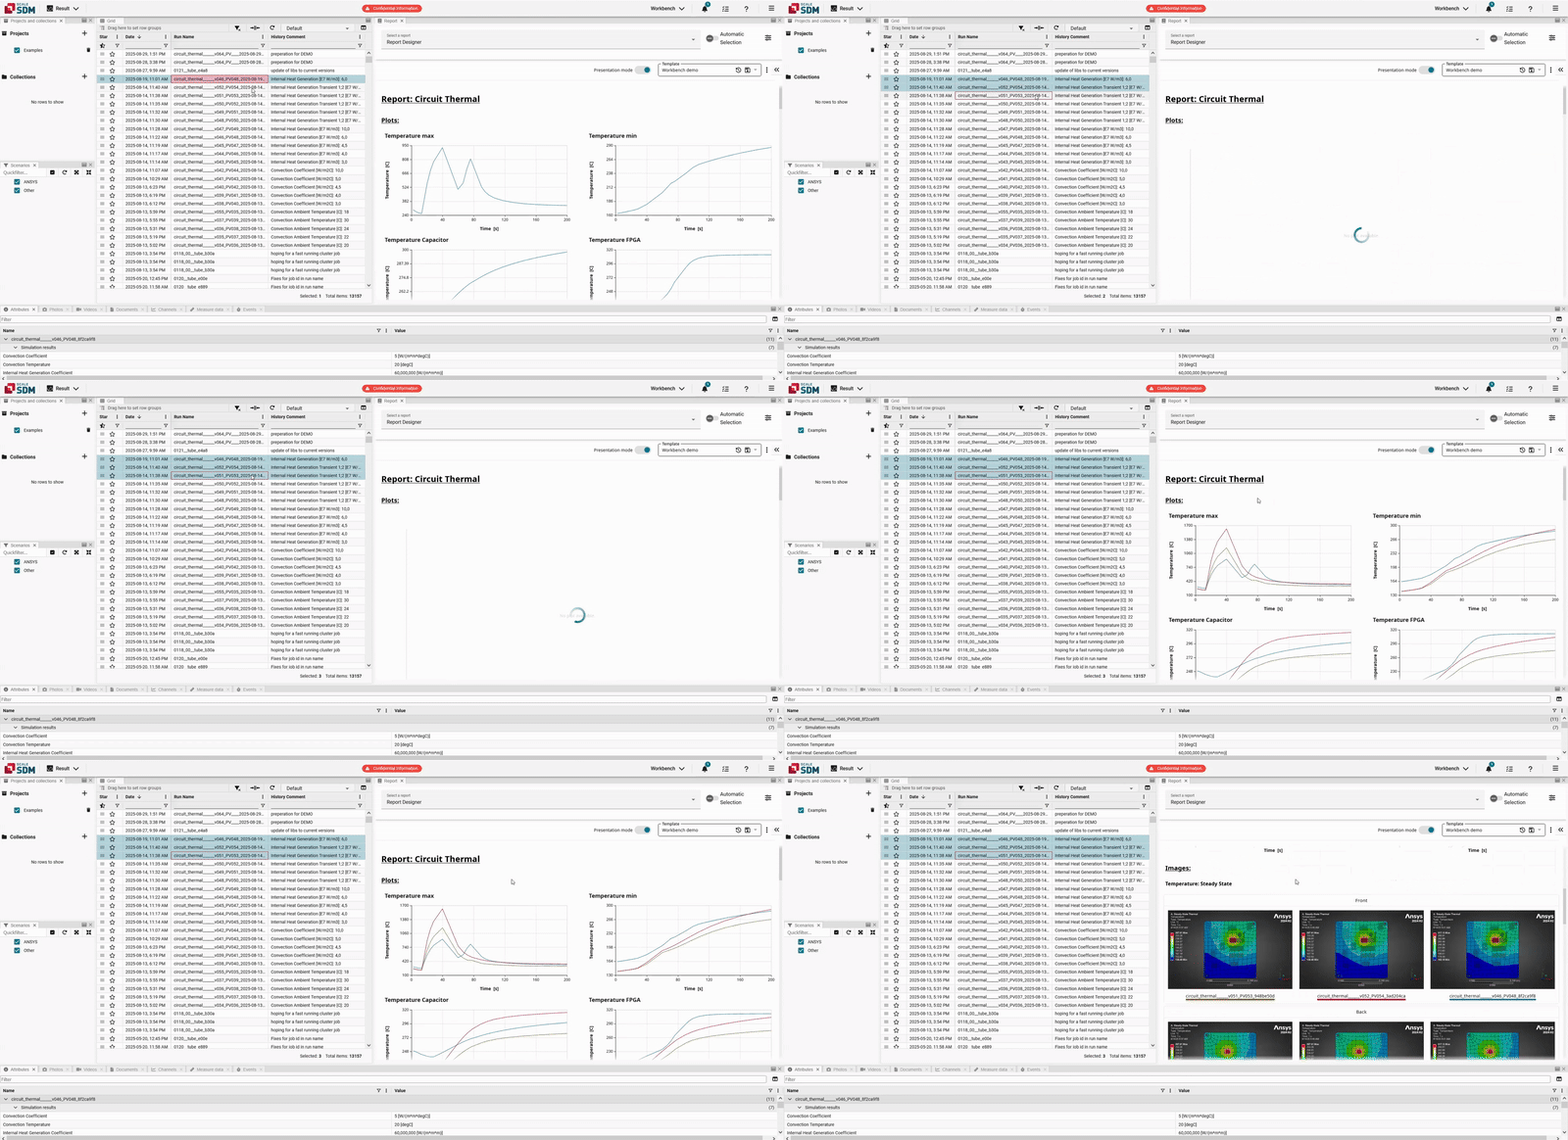
With SCALE.sdm, reporting is fully integrated into the data management environment. When you select results in the grid, the corresponding data is dynamically loaded into your report.
This means you can instantly evaluate whether your simulations or test results meet their target criteria – without switching between tools or manually refreshing data. All information remains live and traceable, ensuring that every KPI, parameter, and result stays linked to its source.
This direct data connection also ensures consistency and transparency throughout the entire evaluation process. Reports in SCALE.sdm are not just static summaries – they are living, data-driven documents that update automatically as new results become available.
Visually Create Reports – With Customizable Widgets
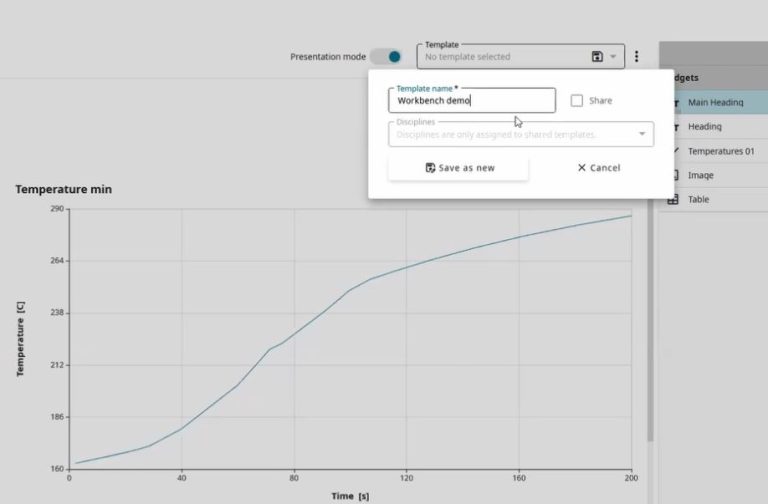
Reports in SCALE.sdm are built from modular “widgets.” Each widget represents an element of your report – e.g., charts, tables, images, videos, or text blocks.
With this, you can:
Insert line charts to visualize channel data
Perform mathematical operations like integrals or differences
Adjust layout and design, from axis labels to colors and lines
Combine multiple widgets into a clear layout
A live preview always shows how your report will look in the end.
Save and Share Templates Across Projects
Once you’ve created a suitable layout, you can save it as a template and share it with colleagues if needed. This allows reports to be efficiently reused and consistently designed across projects.
Simply select the Report Designer in the result test grid, and your simulation results are automatically loaded – individually or in direct comparison of multiple tests.
🎥 In our short video on YouTube, learn step-by-step how to create reports and use the various widgets – from charts to videos – effectively.
Personal consultation
We would like to know more about you and your project. Please use our contact form or get in touch with one of our contacts directly.
You need to load content from reCAPTCHA to submit the form. Please note that doing so will share data with third-party providers.
More InformationYou are currently viewing a placeholder content from Vimeo. To access the actual content, click the button below. Please note that doing so will share data with third-party providers.
More InformationYou are currently viewing a placeholder content from YouTube. To access the actual content, click the button below. Please note that doing so will share data with third-party providers.
More InformationYou need to load content from reCAPTCHA to submit the form. Please note that doing so will share data with third-party providers.
More Information


