Back

Suchergebnisse

      Home / Products / Add-ons and Tools / Data Analysis

      Data Analysis

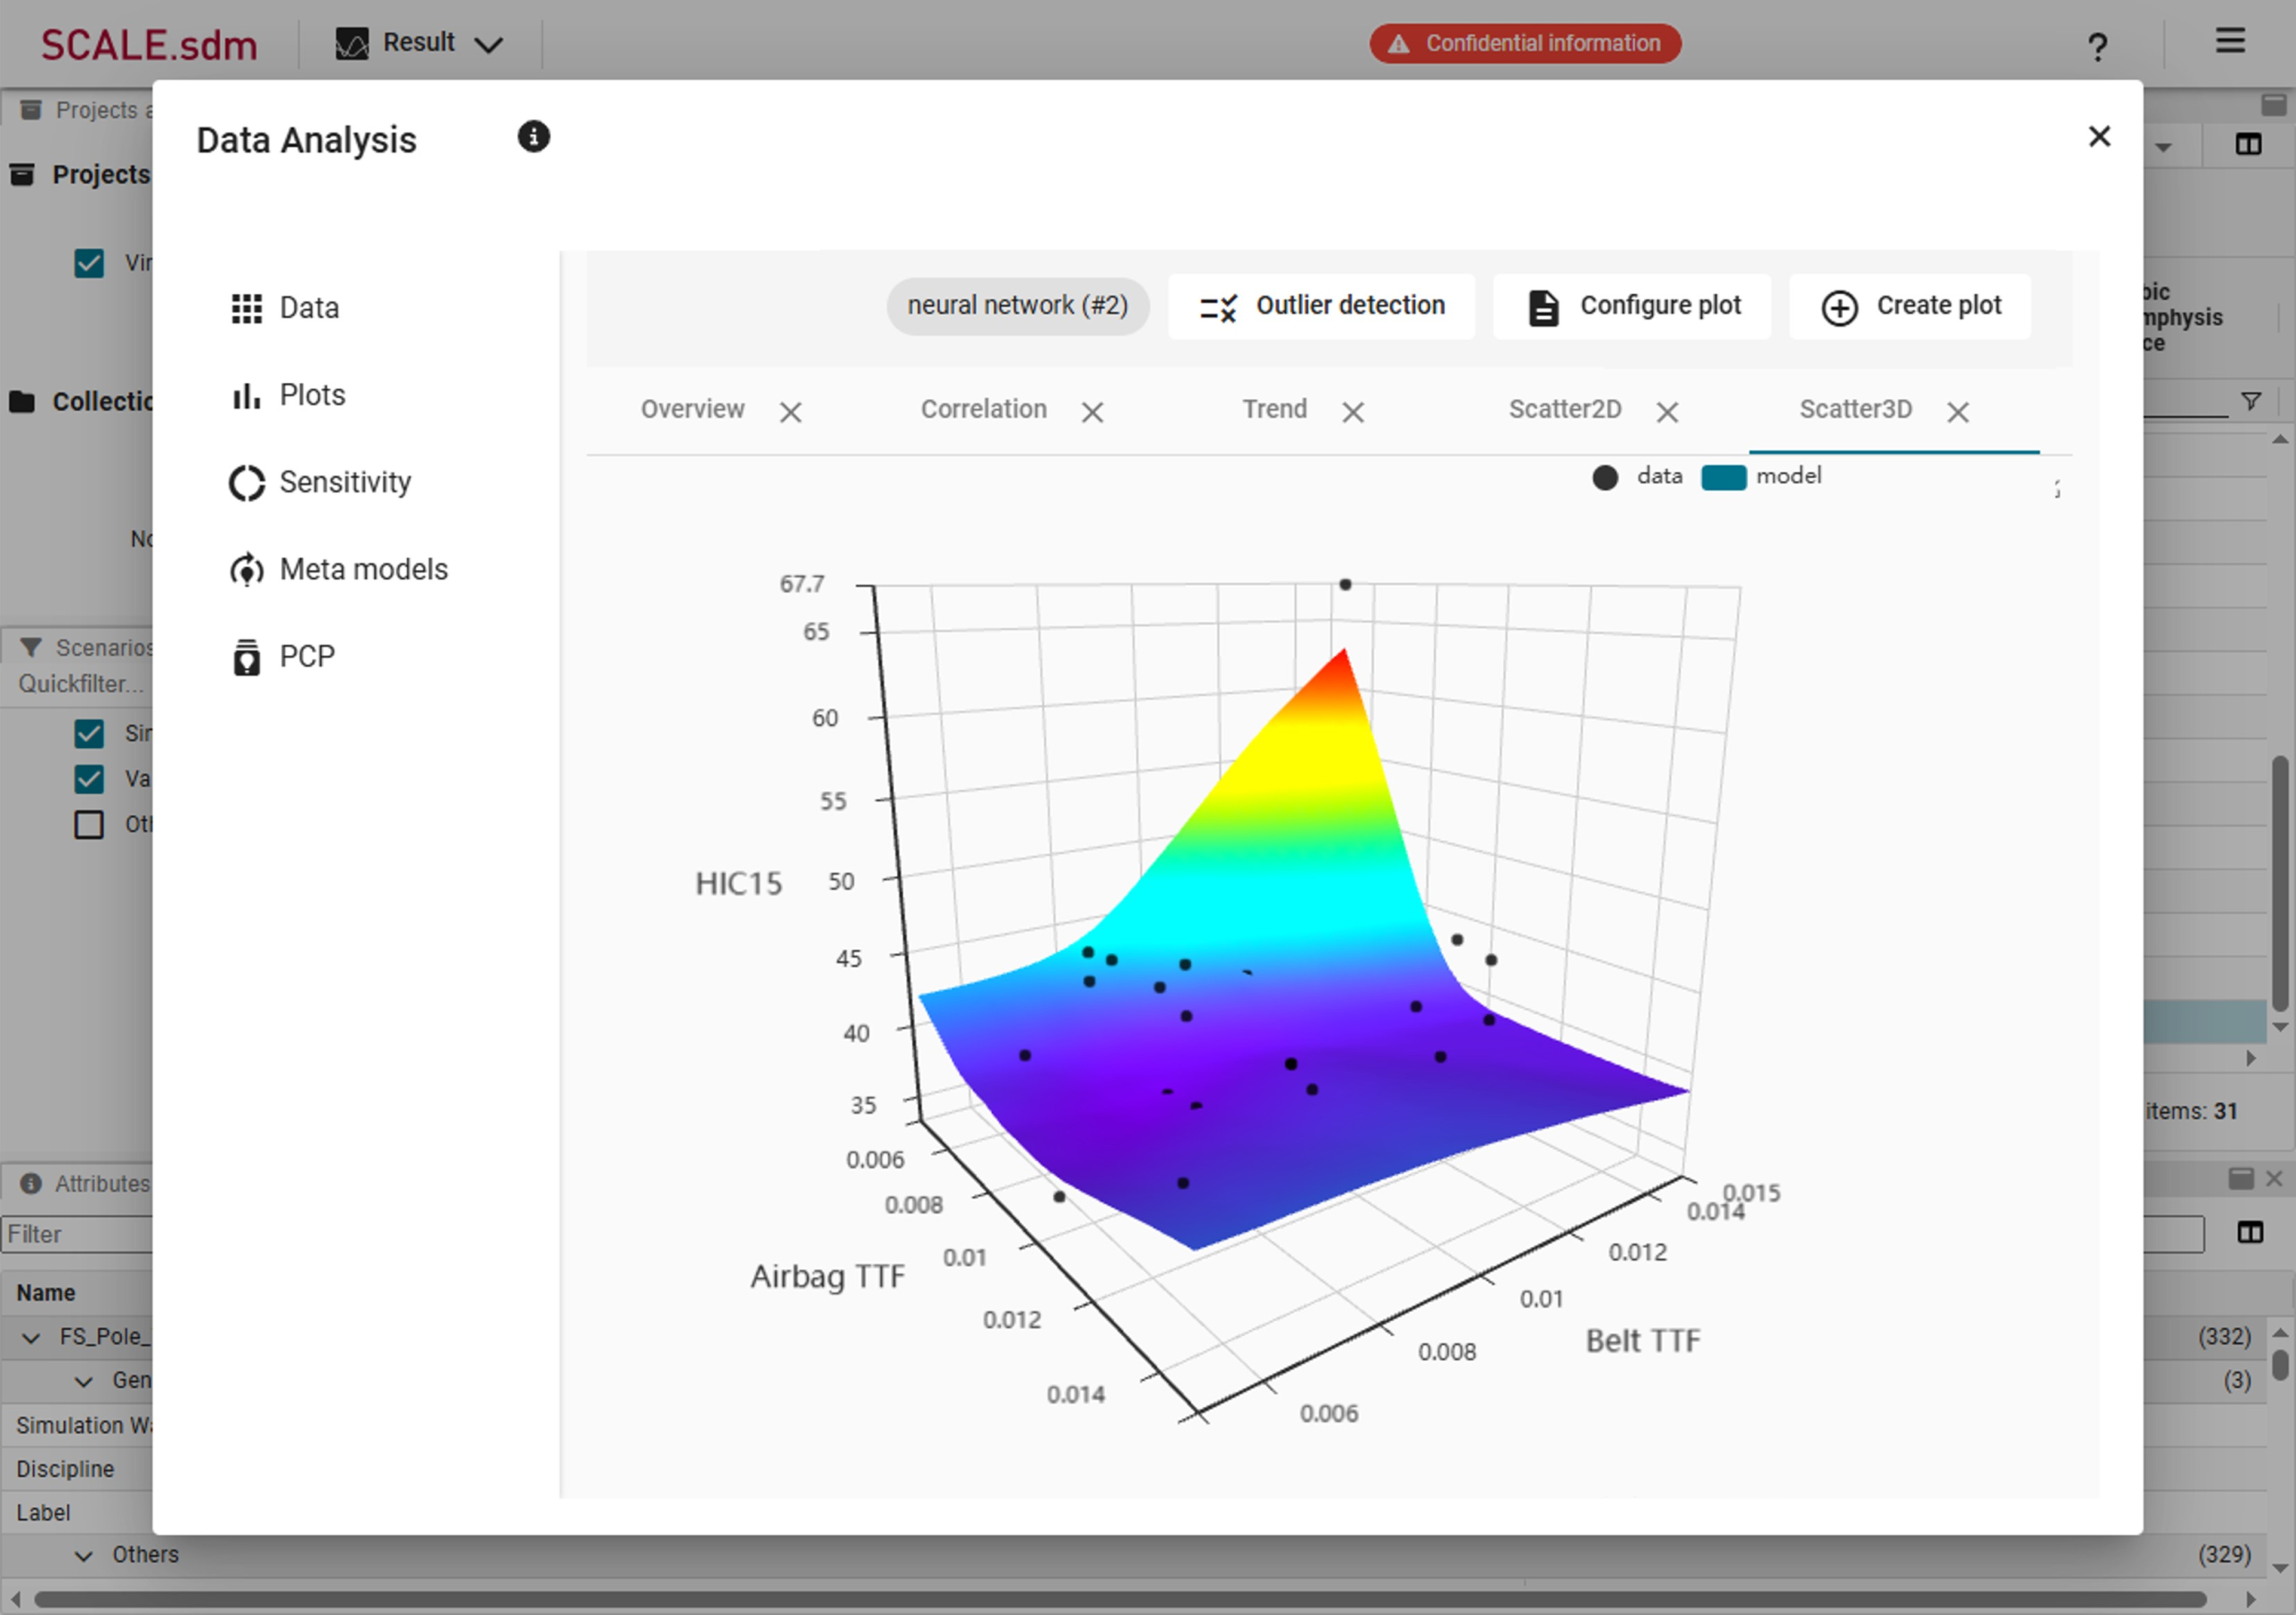
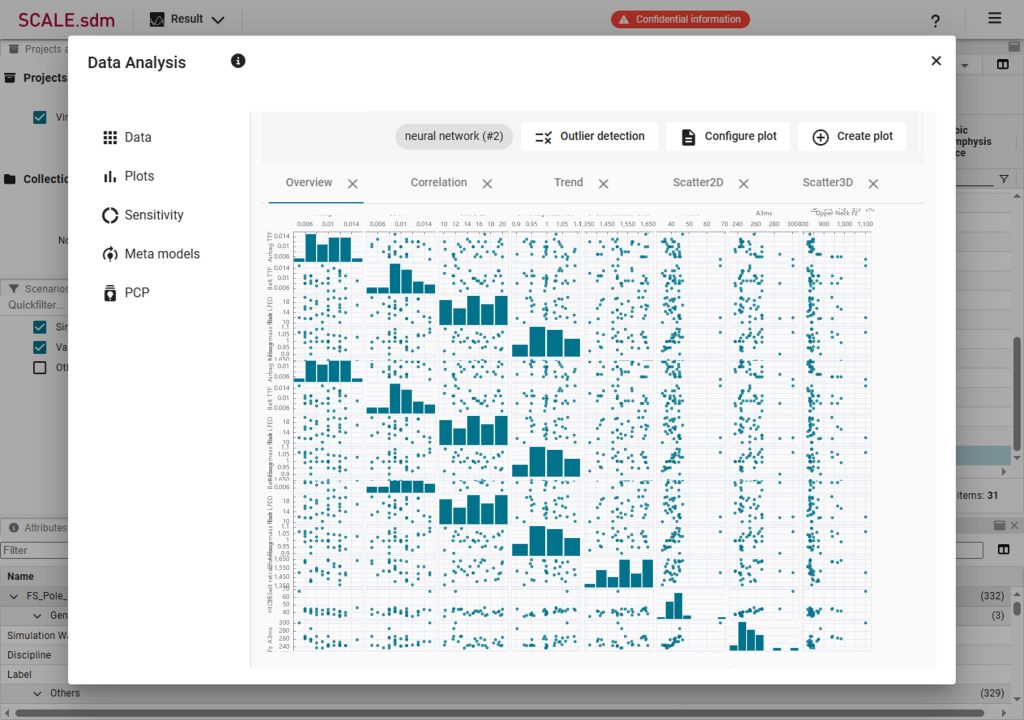
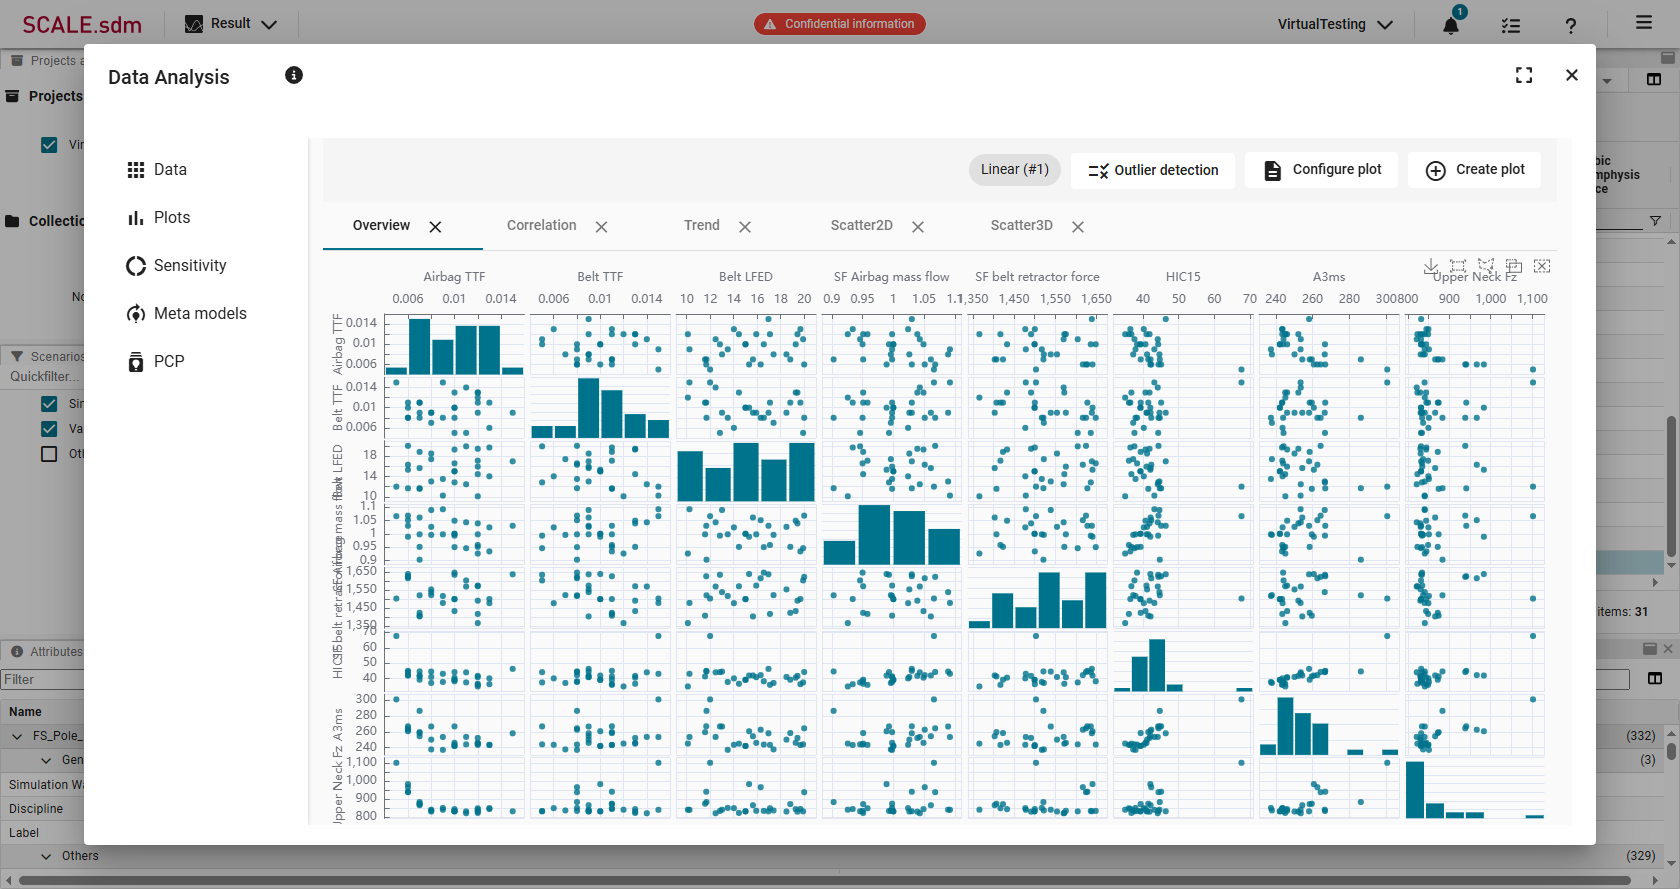
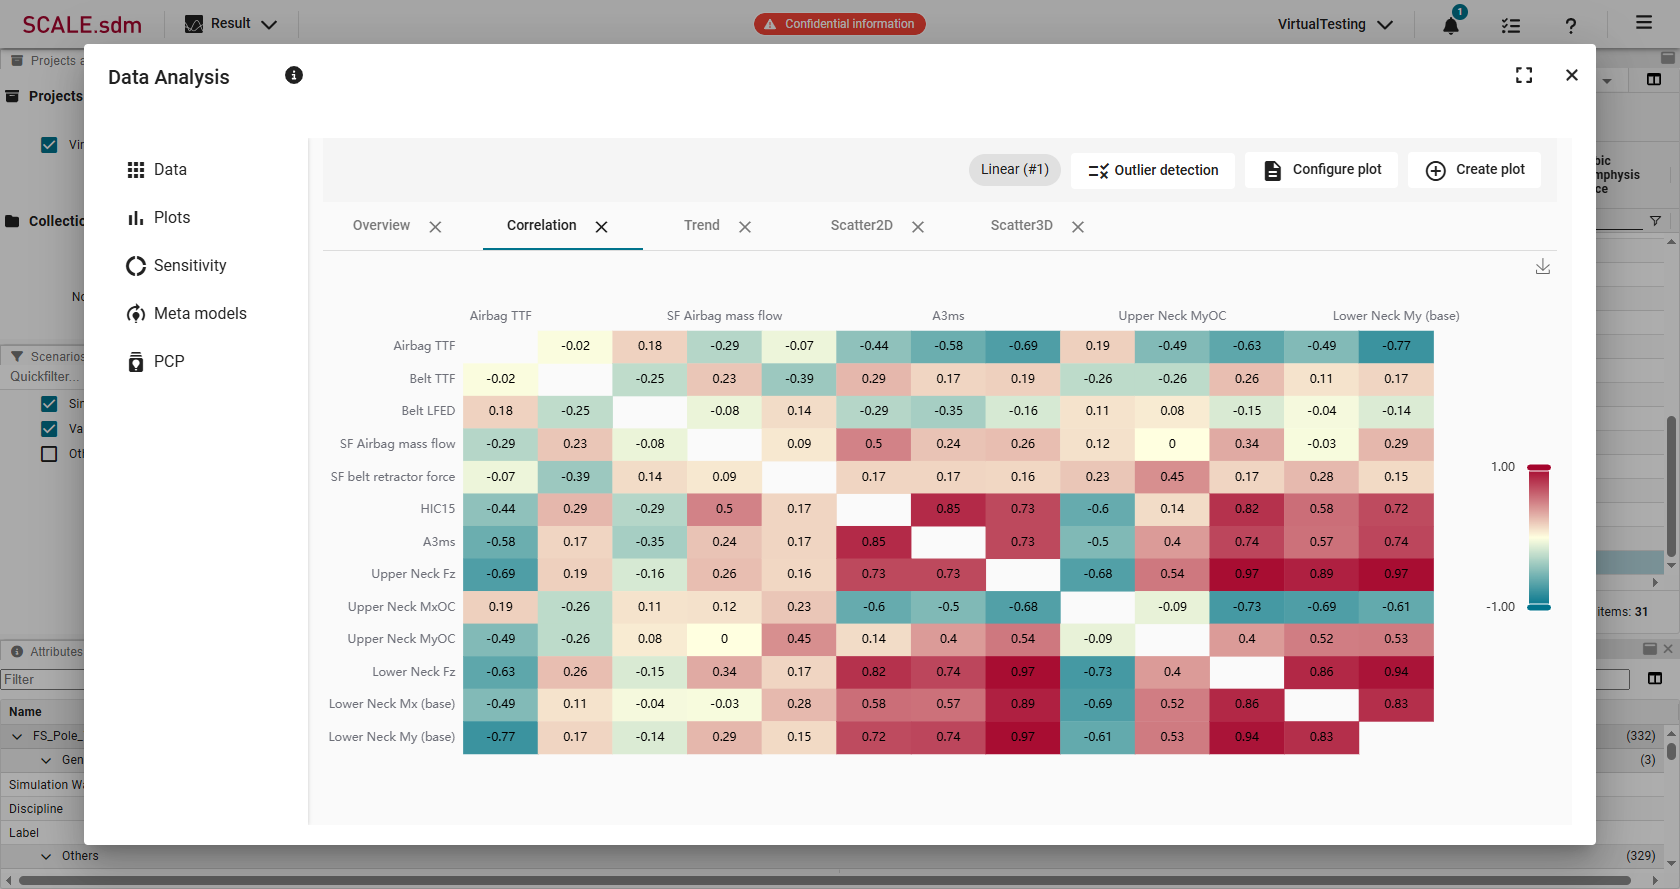
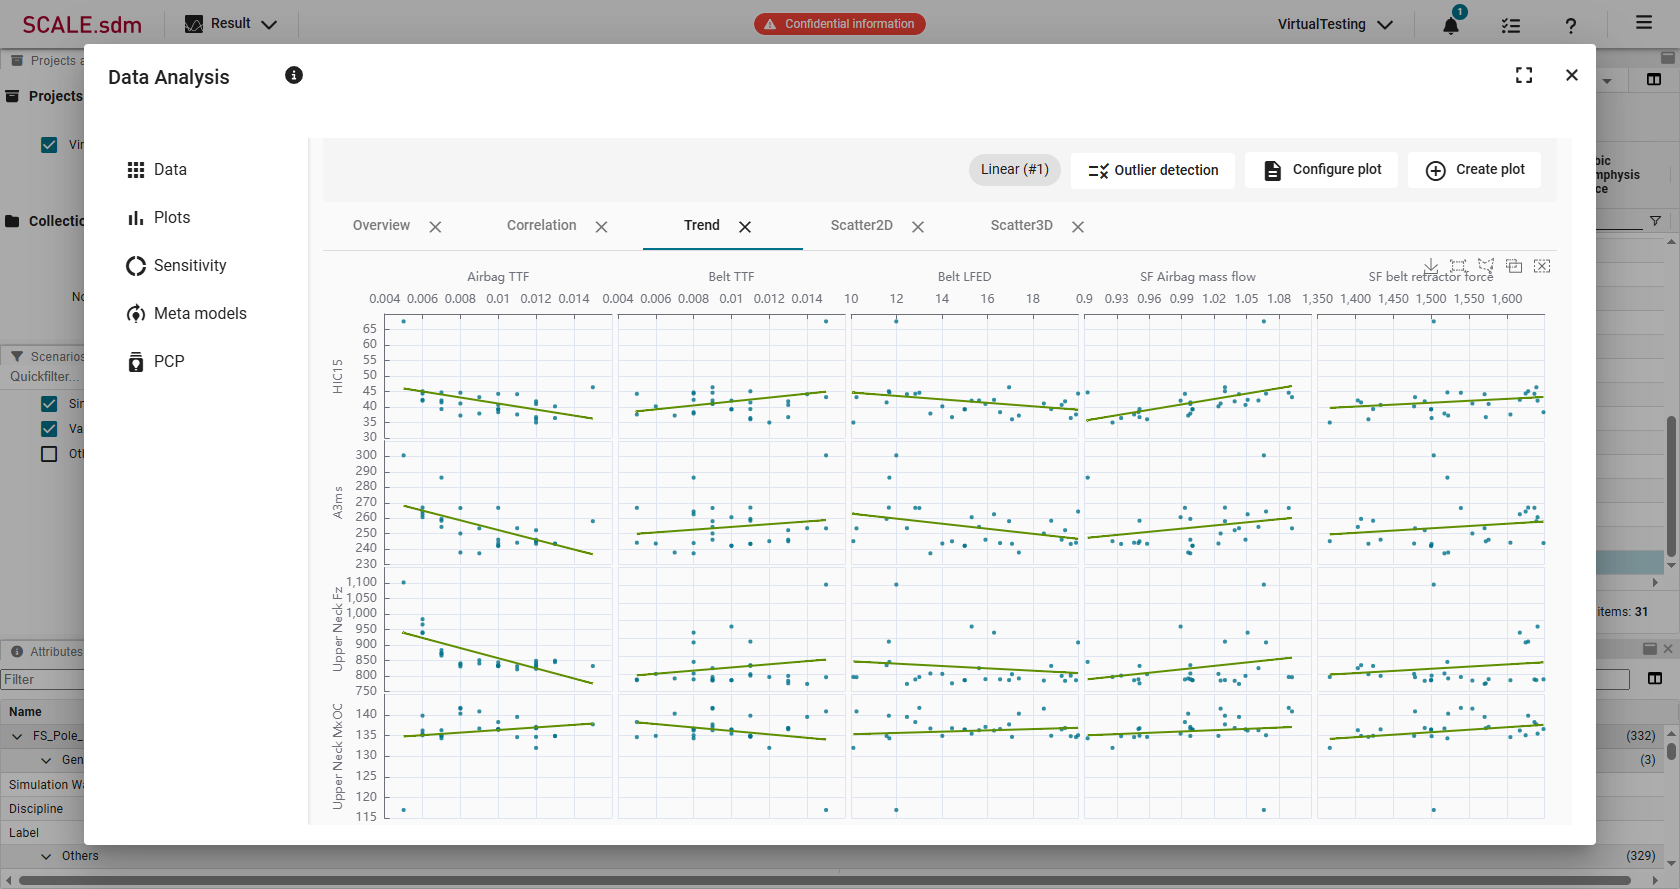
      See Patterns. Spot Outliers. Gain Insights.

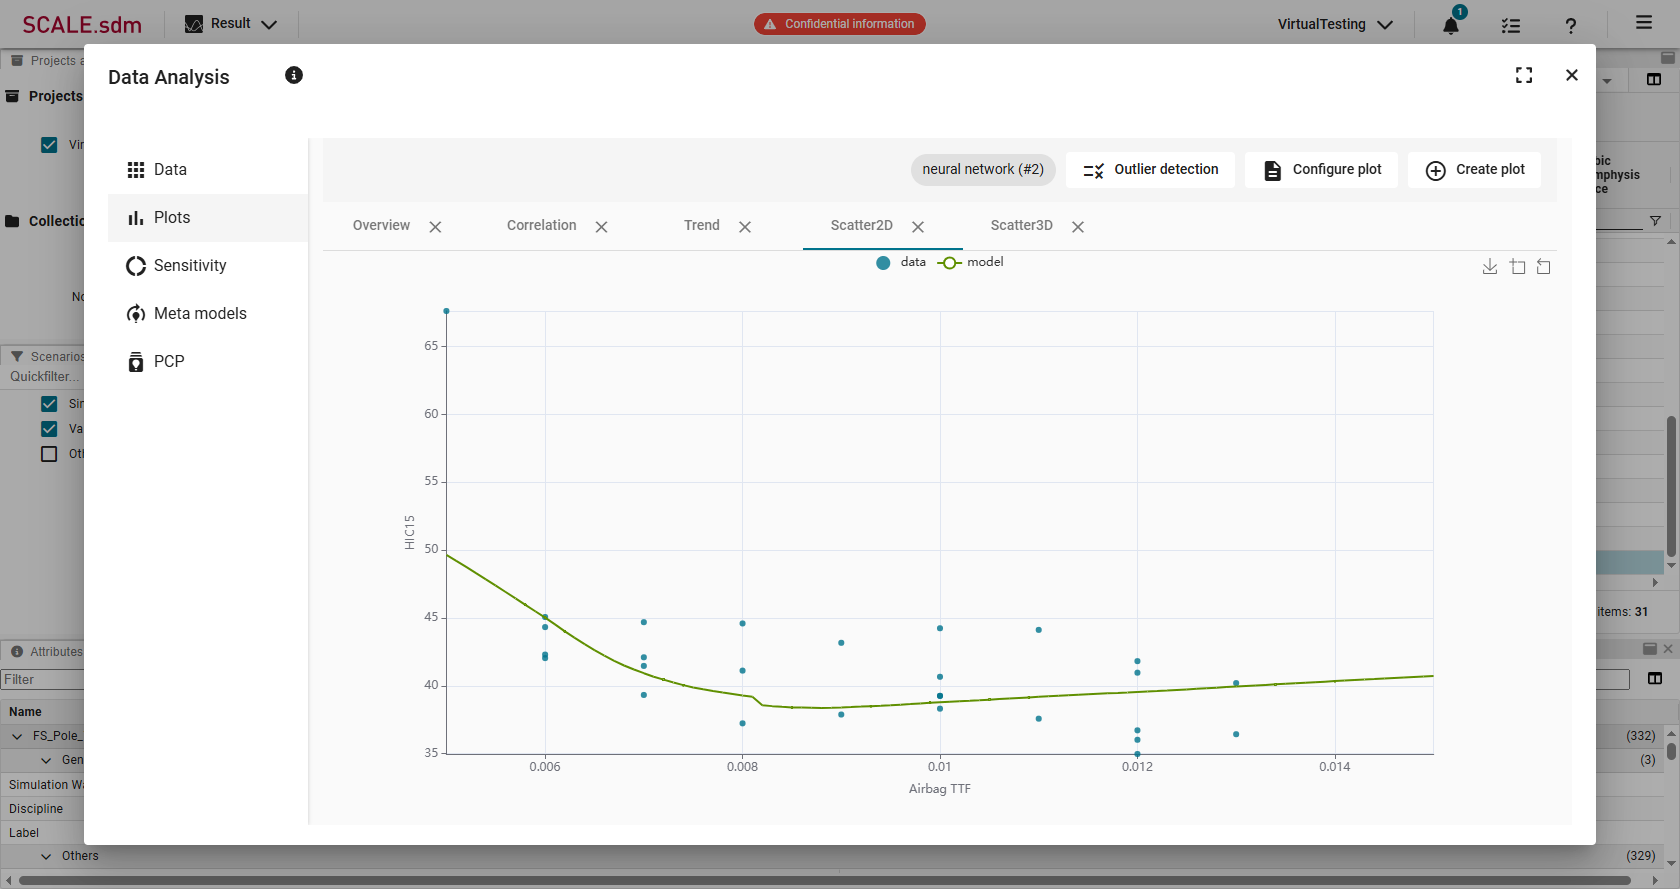
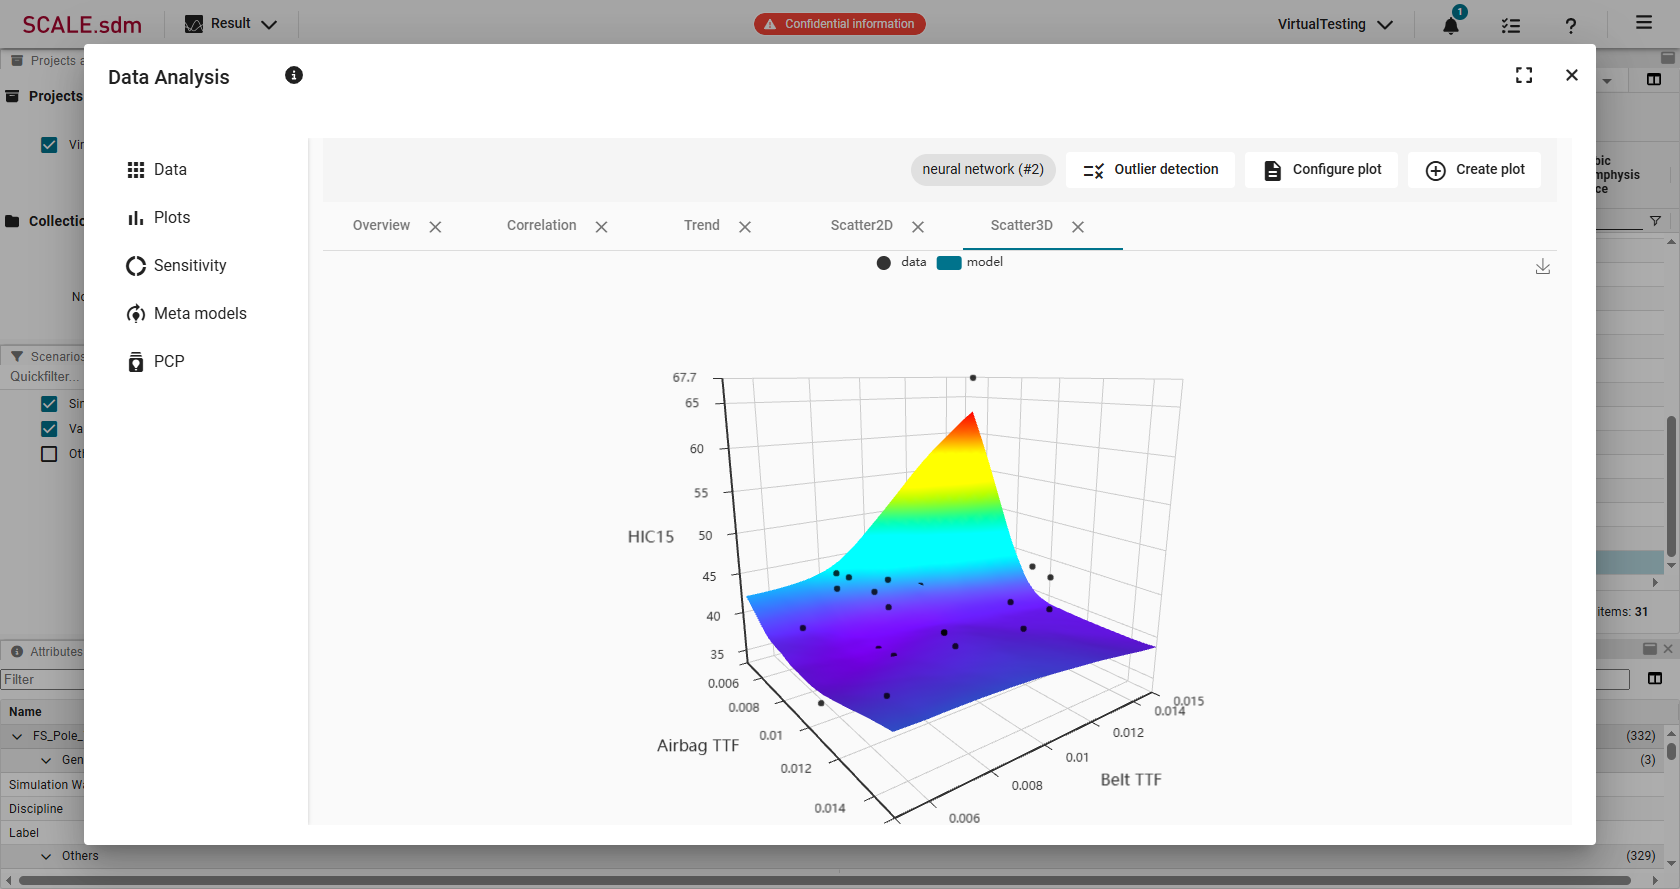
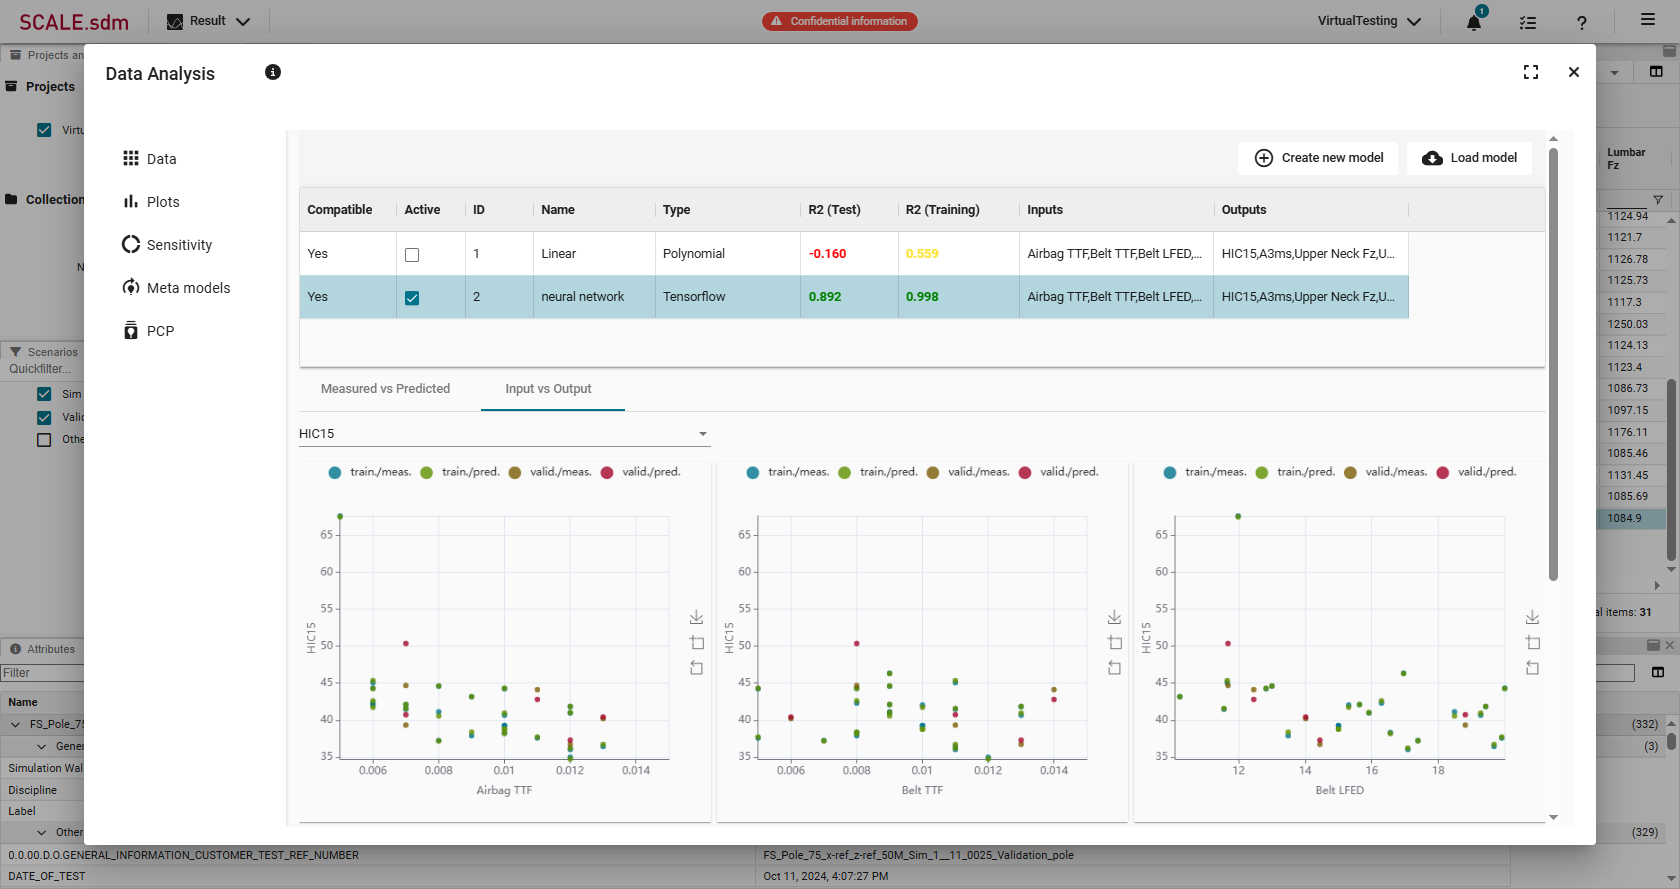
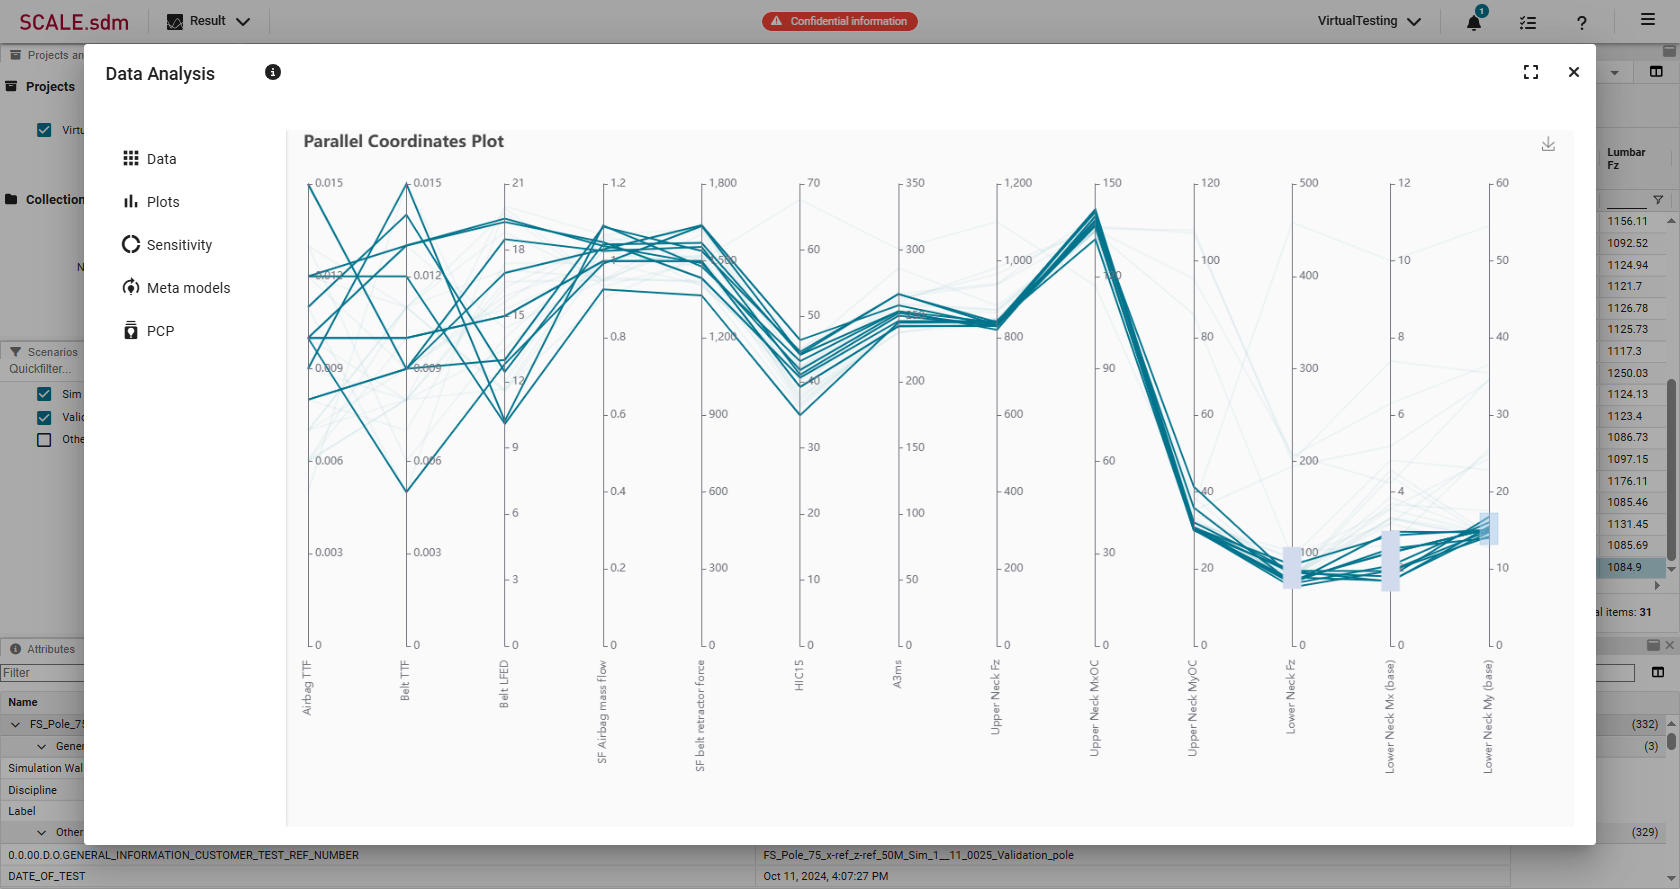
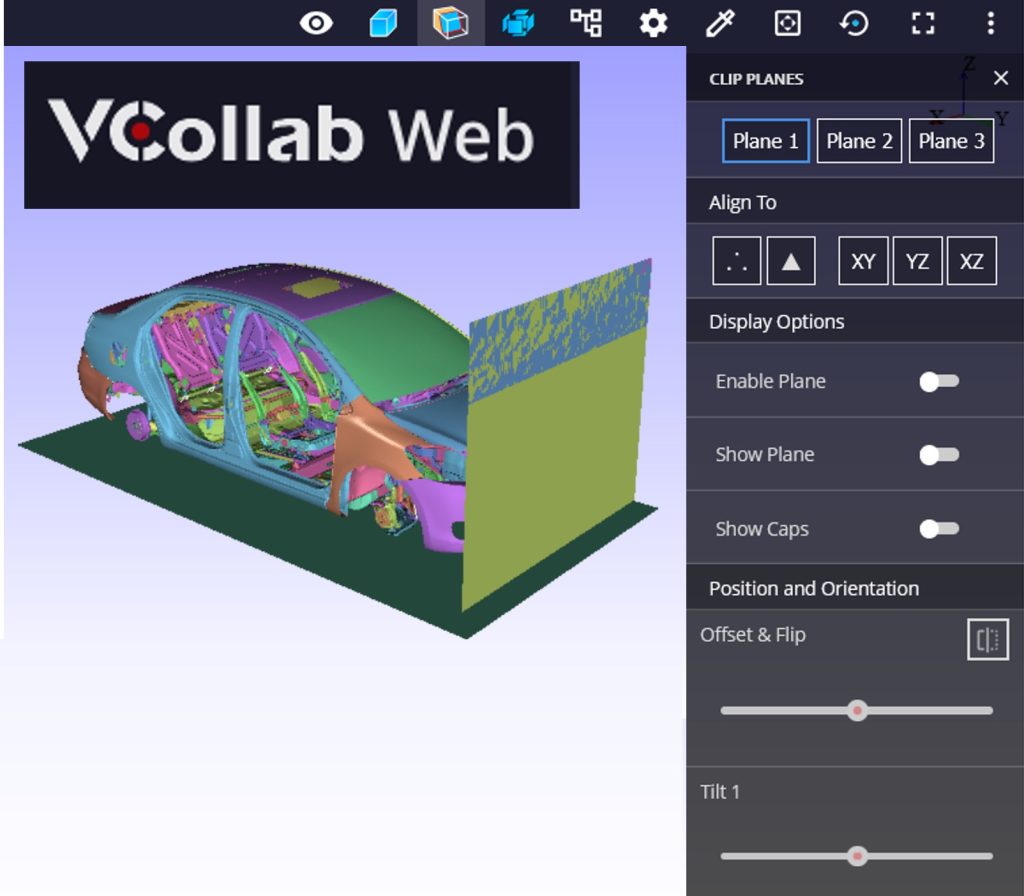
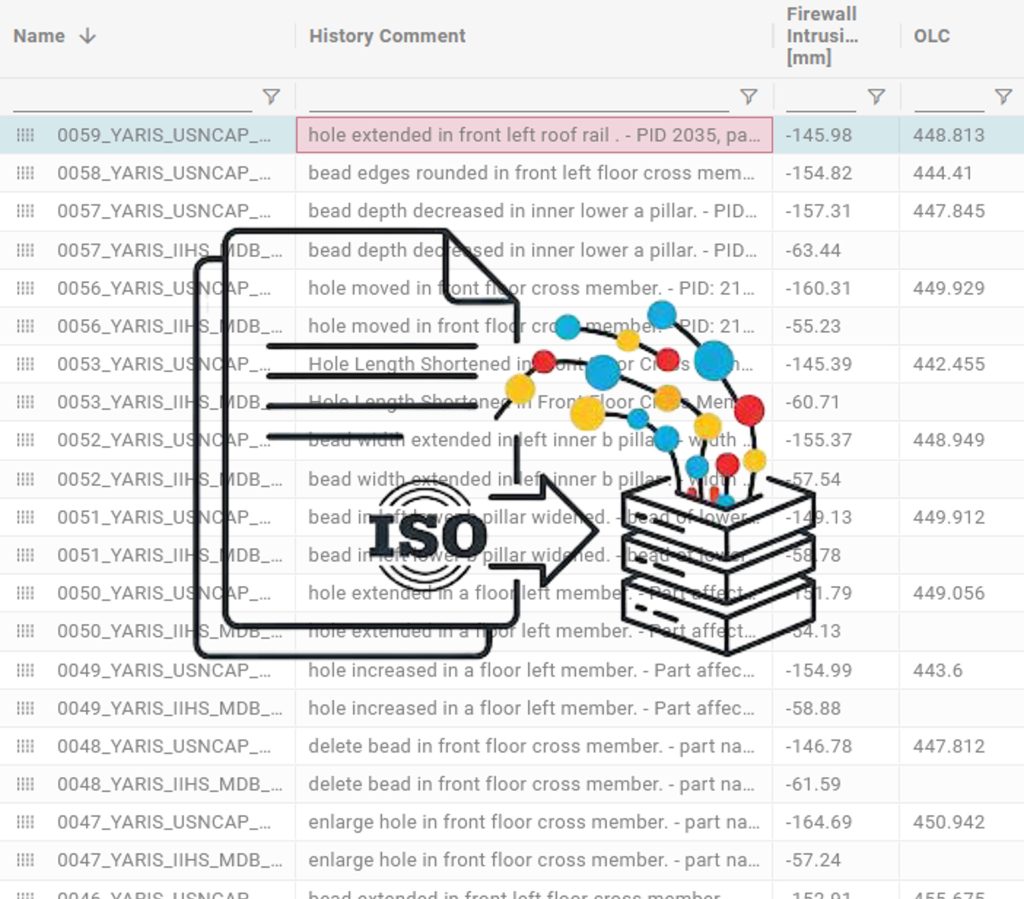
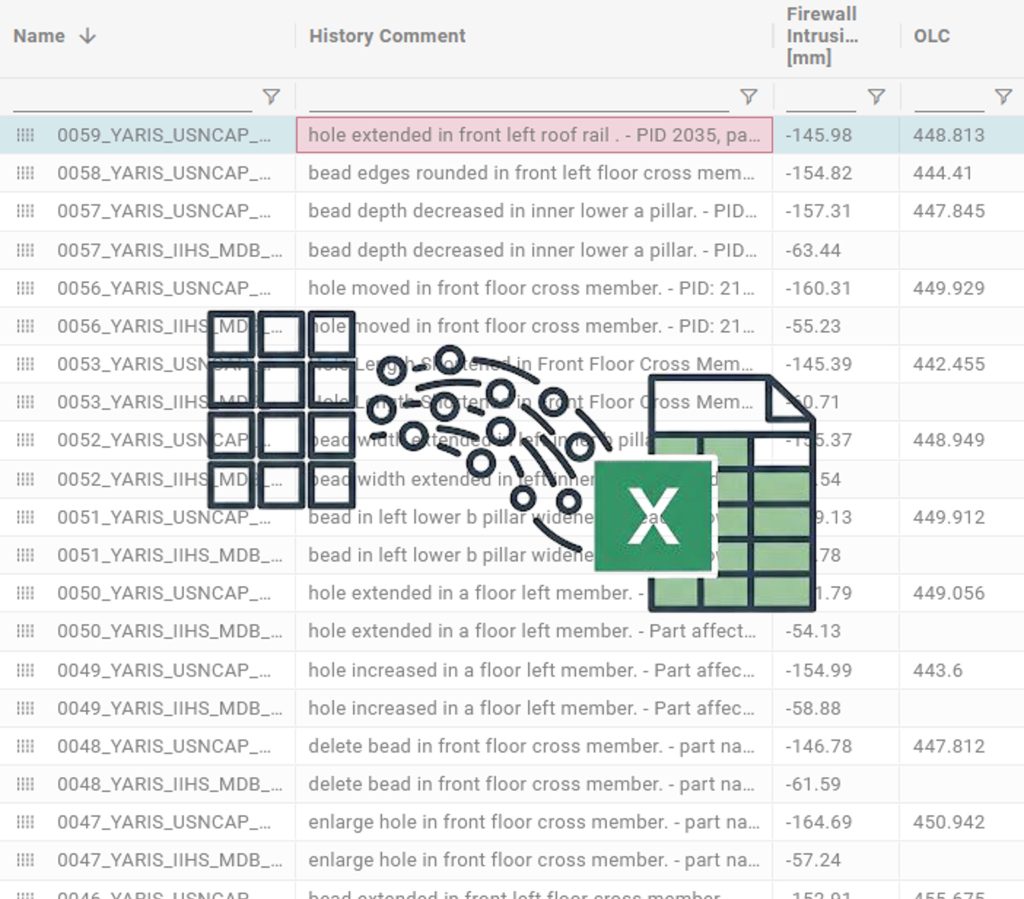
      Dig deeper into your test data with the Data Analysis add-on, fully embedded in SCALE.sdm. Visualize trends, spot outliers, and understand complex relationships.

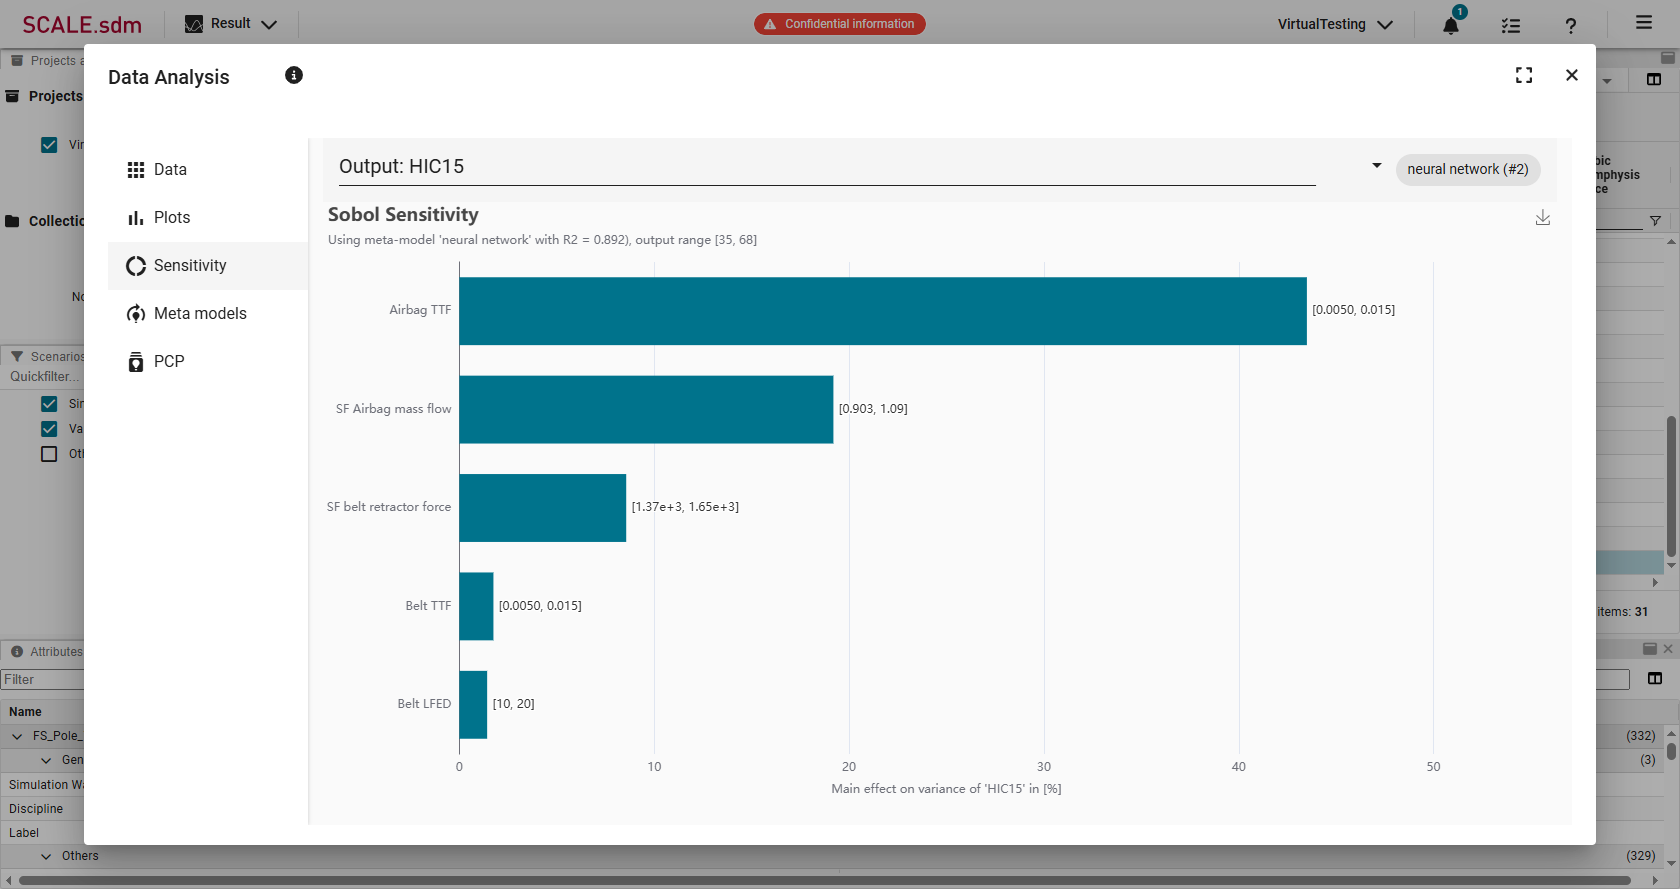
      Explore your data interactively and gain insights that drive smarter decisions by uncovering patterns, detecting anomalies, evaluating sensitivities, and building predictive surrogate models.

      Key Capabilties

      • Plot data and visualize trends: Quickly create scatter plots, trend lines, and correlation graphs to uncover patterns.
      • Detect outliers and anomalies: Identify unusual data points manually or automatically to improve data quality.
      • Analyze relationships: Use correlation and anthill plots to understand complex dependencies.
      • Perform sensitivity analysis: Evaluate non-linear effects of input variables on outcomes for deeper insights.
      • Build surrogate models: Create and validate predictive models using neural networks or polynomial regression for forecasting and visualization.

      Interactive - Tailored to Your Data

      Analyze and refine your data seamlessly, right within SCALE.sdm’s web interface.

      • Filter and structure data sets dynamically
      • Select data easily within the grid and immediately apply it for analysis and visualization
      • Hide anomalies to clean up visualizations
      • Work directly in the web browser – no extra software needed

      Your Trial License

      We look forward to your enquiry!

      SCALE.sdm is an integrated software solution for seamless simulation data and process management, providing a powerful system solution for virtual product development.

      Contact

      Yasmina Wagner

      Distribution, Licensing

      Personal consultation

      We would like to know more about you and your project. Please use our contact form or get in touch with one of our contacts directly.